Trust AI agents with
anti-money laundering
Delegate investigative work to AI agents, from L1 to L3 reviews, with consistency, auditability and traceability.
Built for institutions regulated by


Built for consistency and accuracy
of detection and reporting
Variance AI agents collect 90% of the evidence for each case, reducing investigative cycles by 10×, while ensuring traceability, observability, and explainability.
Unusual $48k wire to Hong Kong shell company
10:42:03 AM
Shell company registered 3 weeks ago — no website, no employees
10:42:06 AM
Director: 陳偉明 (transliterated: Chan Wai Ming)
10:42:11 AM
No direct match — but partial alias overlap with SDN entry
10:42:17 AM
Found cached LinkedIn with matching photo and alt spelling
10:42:25 AM
Same person named in 2023 ICIJ investigation on trade-based laundering
10:42:34 AM
6 artifacts, 4 data sources
10:42:37 AM
Built for regulators and auditors
Every decision comes with a complete evidence trail, cited sources and audit-ready traces.
Novel context to your existing detection and alerts
Close false alerts rapidly by having agents replicate your existing manual investigative workflows.
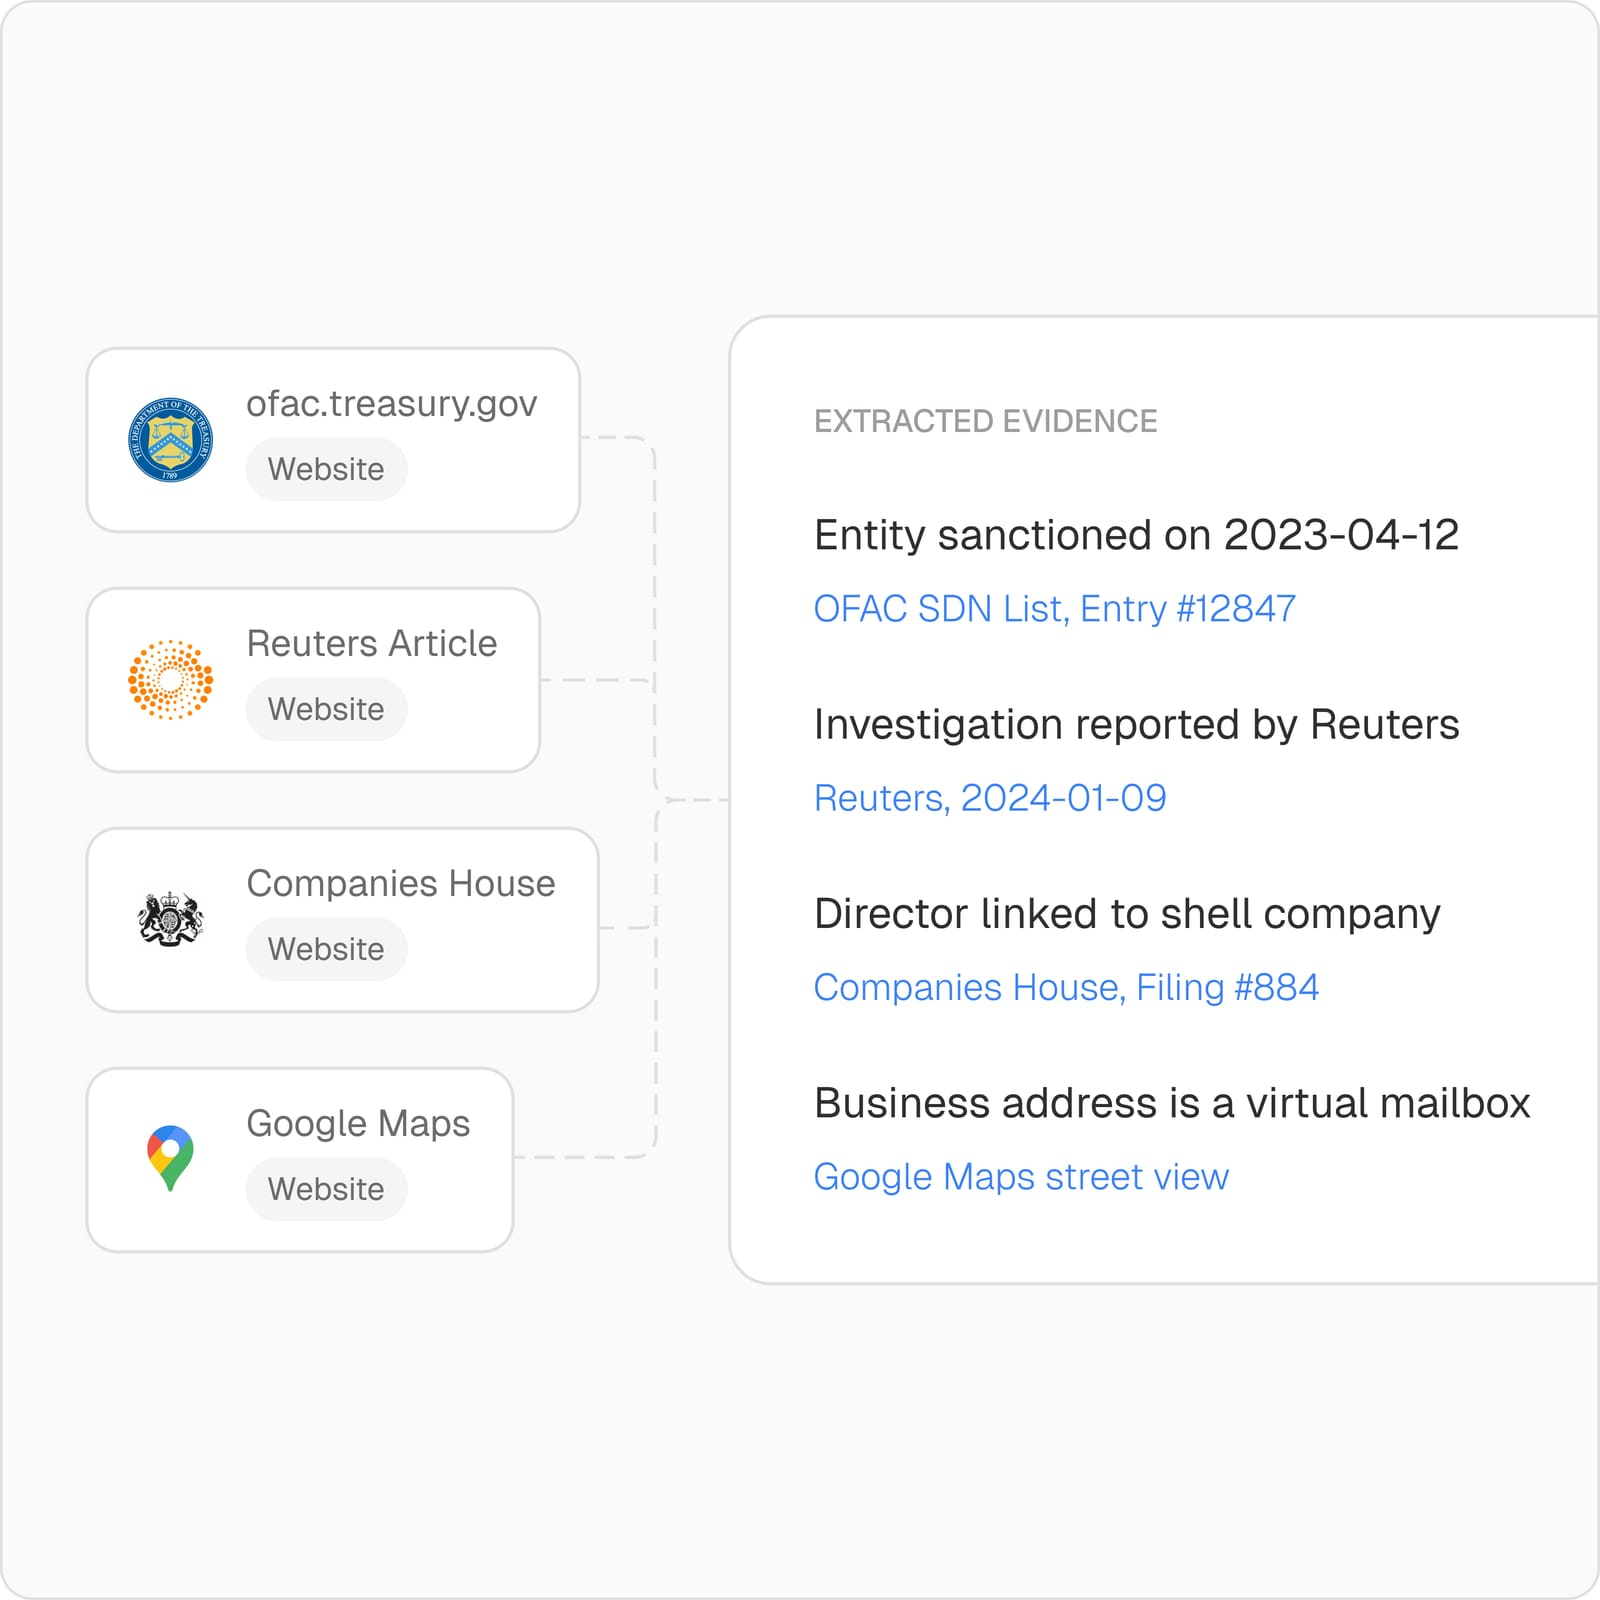
Unstructured evidence, structured insight
Agents can extract insights hidden in messy data, including scanned or handwritten documents, images, and websites.